open office calc tutorial2 - how to create charts
View this video in high resolution

open office calc tutorial2 - how to create charts

opensourcesource.wikispaces.com/

This video tutorial shows you how to create charts in Calc and some additional formatting tips.

- Creating graphs
- Editing column widths
- Formatting cells

Rating : 0.0/5 (0 votes)

Add to Favourites
Change level
Share
Flag

Share :

MySpace Facebook Digg Stumbleupon
del.icio.us orkut Bebo Spaces

License :

No license (All rights reserved)
 
0 Comment

Would you like to comment?

Join skillmotion for a free account or log in if you are already a member.

Videos related :
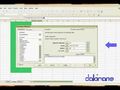
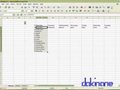
open office calc - Explanation of the interface
0 Ratings
4501 Views
Posted by :dakinane
 
open office calc tutorial 3 - Inbuilt functions within Calc
0 Ratings
4374 Views
Posted by :dakinane
 
Visit my website:

Posted by : dakinane
27 vid. | RSS

Duration : 06:23
Added: 14 years ago
Category: Calc

 
Embed this Video
Permalink